Visualization
There are a few different approaches to visualise the EEG Data. One of the most interesting and cool visualization technique is to view the brain activity as topographical map.
Topographical Map
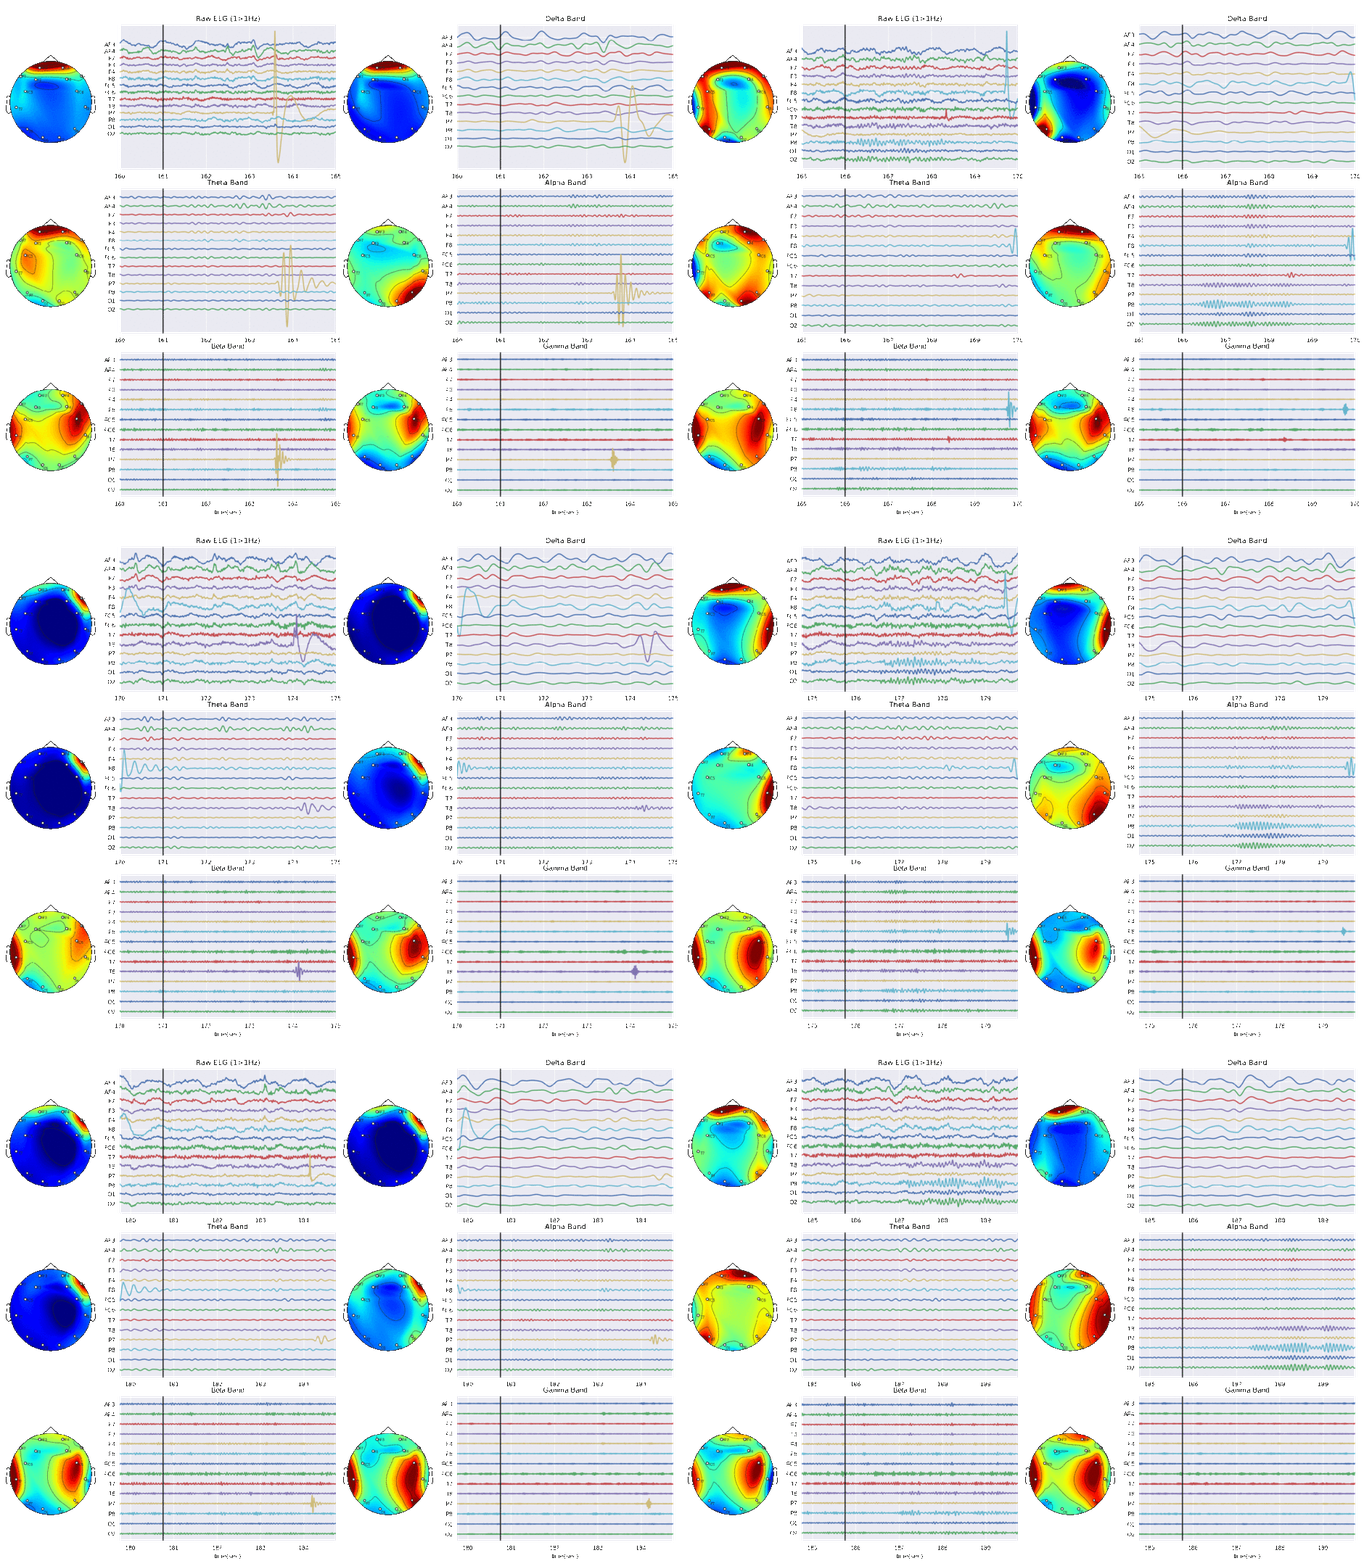
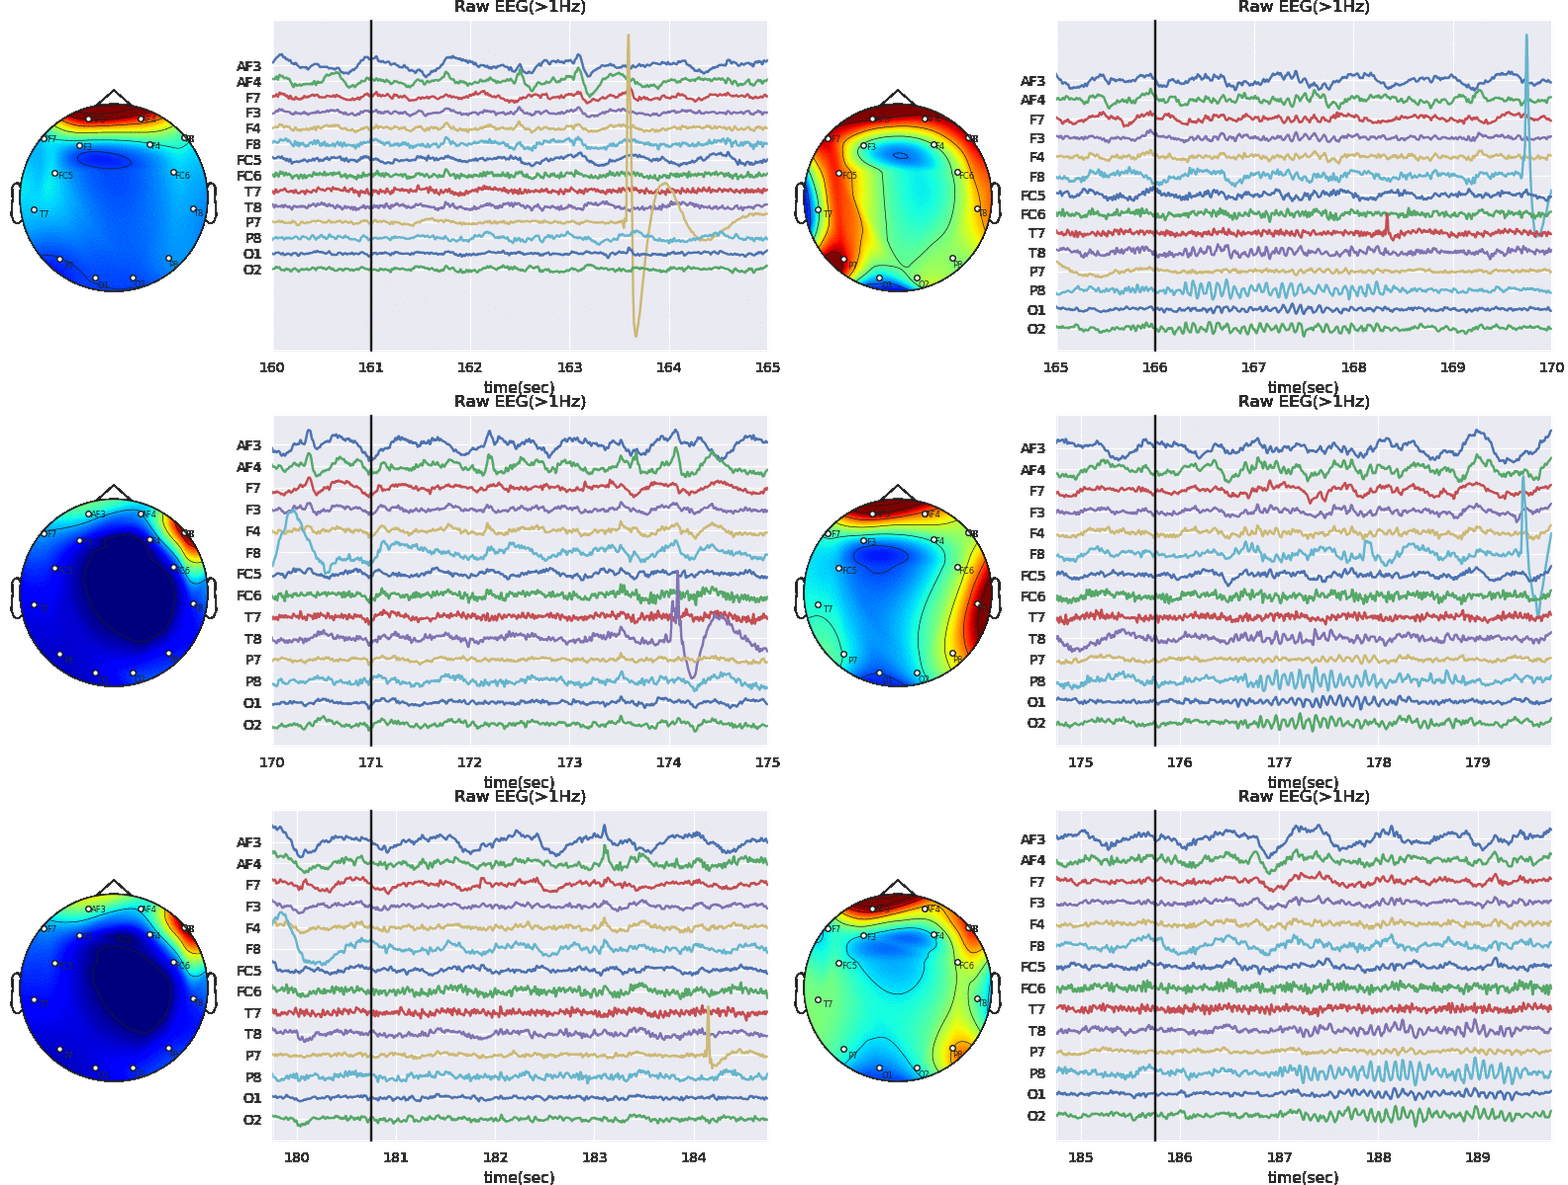
Topographical map display the activity of brain on a 2D circular picture as to maintained the spatial realtionship of electrodes. The values are shown as heat-map, which could represent firing rate of neurons at the given site, spectral power or total energy of signal, or some other measure. Following figure shows Brain activity as measured by energy of signal at given sites. The dynamics of the activity is measured by computing energy of signals over 1 sec window and shifting it by 0.5 sec. Top left figure shows the activity extracted from raw EEG, and other figures shows corresposing brain activity in different frequency bands.
To generate such plots for static or dynamic measurements, python library - spkit is used. For details check following link - https://spkit.github.io/examples/gen_topo


